
Page 78 - MELLBY_MAGASIN_EN_2024
P. 78
MELLBY GÅRD
EBITDA
3,121
SEK M
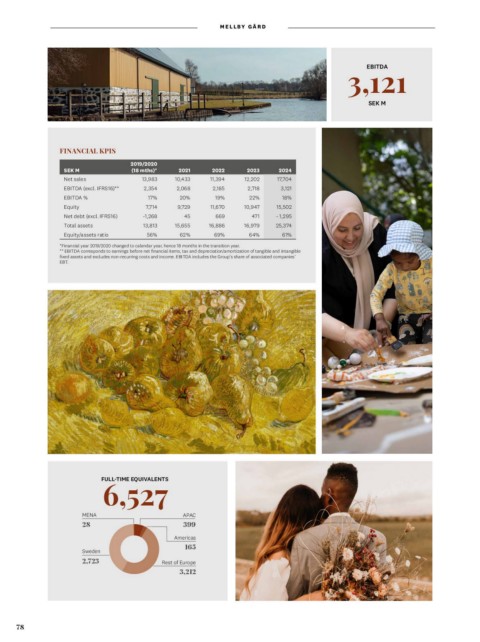
FINANCIAL KPIS
SEK M 2019/2020 2021 2022 2023 2024
Net sales (18 mths)* 10,433 11,394 12,202 17,704
EBITDA (excl. IFRS16)** 2,068 2,185
EBITDA % 13,983 2,718 3,121
Equity 2,354 20% 19% 22% 18%
Net debt (excl. IFRS16) 9,729 11,670 10,947 15,502
Total assets 17% 471 - 1,295
Equity/assets ratio 7,714 45 669 16,979 25,374
-1,268 15,655 16,886 64% 61%
13,813
56% 62% 69%
*Financial year 2019/2020 changed to calendar year, hence 18 months in the transition year.
** EBITDA corresponds to earnings before net financial items, tax and depreciation/amortization of tangible and intangible
fixed assets and excludes non-recurring costs and income. EBITDA includes the Group’s share of associated companies’
EBT.
MENA FULL-TIME EQUIVALENTS APAC
28 6,527 399
Sweden Americas
2,723 165
Rest of Europe
3,212
78