
Page 9 - Danir_Klimatbokslut_digital_2023_ENG
P. 9
CHAPTER 3 | Danir GHG inventory report 2023 9
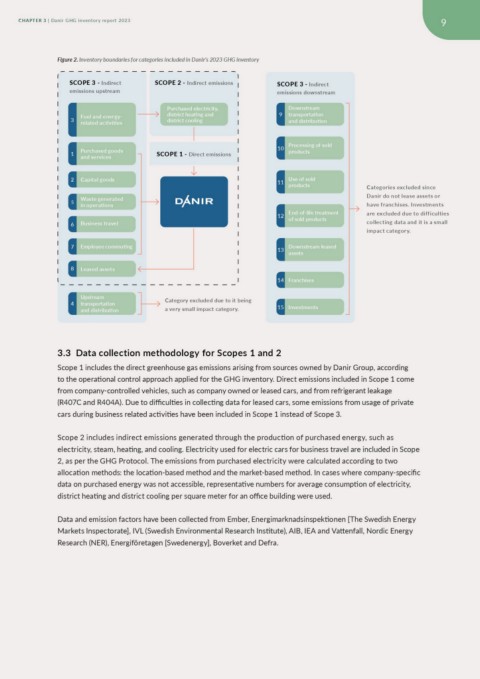
Figure 2. Inventory boundaries for categories included in Danir’s 2023 GHG inventory
SCOPE 3 - Indirect SCOPE 2 - Indirect emissions SCOPE 3 - Indirect
emissions upstream emissions downstream
Purchased electricity,
3 Fuel and energy- district heating and Downstream
related activities district cooling 9 transportation
and distribution
Purchased goods SCOPE 1 - Direct emissions 10 Processing of sold
and services products
1
2 Capital goods 11 Use of sold
products
Categories excluded since
5 Waste generated Danir do not lease assets or
in operations have franchises. Investments
are excluded due to difficulties
12 End-of-life treatment collecting data and it is a small
of sold products impact category.
6 Business travel
7 Employee commuting 13 Downstream leased
assets
8 Leased assets
14 Franchises
Upstream Category excluded due to it being 15 Investments
4 transportation a very small impact category.
and distribution
3.3 Data collection methodology for Scopes 1 and 2
Scope 1 includes the direct greenhouse gas emissions arising from sources owned by Danir Group, according
to the operational control approach applied for the GHG inventory. Direct emissions included in Scope 1 come
from company-controlled vehicles, such as company owned or leased cars, and from refrigerant leakage
(R407C and R404A). Due to difficulties in collecting data for leased cars, some emissions from usage of private
cars during business related activities have been included in Scope 1 instead of Scope 3.
Scope 2 includes indirect emissions generated through the production of purchased energy, such as
electricity, steam, heating, and cooling. Electricity used for electric cars for business travel are included in Scope
2, as per the GHG Protocol. The emissions from purchased electricity were calculated according to two
allocation methods: the location-based method and the market-based method. In cases where company-specific
data on purchased energy was not accessible, representative numbers for average consumption of electricity,
district heating and district cooling per square meter for an office building were used.
Data and emission factors have been collected from Ember, Energimarknadsinspektionen [The Swedish Energy
Markets Inspectorate], IVL (Swedish Environmental Research Institute), AIB, IEA and Vattenfall, Nordic Energy
Research (NER), Energiföretagen [Swedenergy], Boverket and Defra.