
Page 13 - Danir_Klimatbokslut_digital_2022_ENG_240122
P. 13
13 Danir GHG inventory report 2022 | CHAPTER 4
4.3.5 WASTE GENERATED IN OPERATIONS
This category relates to management of waste generated from the company’s own operations. The two
primary waste items that arise in Danir’s operations are household waste and food waste, which undergo
energy recovery or are digested into biogas. The energy recovered from waste management replaces other
energy production, which means that the waste generated is classified and used as a resource that thereby
contributes to reduced climate impact in other sectors, instead of giving rise to increased climate impact (Mili-
ute-Plepiene, Sundqvist, Stenmarck, & Zhang, 2019). According to the GHGP principles, no negative or avoid-
ed emissions should be reported, which means that only transportation in waste management can be reported
as a climate-impacting activity. As such transportation has been assessed as a small impact category and it
was not possible to collect a large enough data set for waste transportation, no emissions could be allocated
to the “waste generated in operations” category this year.
4.3.6 BUSINESS TRAVEL
The business travel category includes all journeys made for business purposes. Since Danir does not have any
climate impact from business travel that falls within Scope 1 or 2, all emissions derived from this item are includ-
ed in Scope 3. The category includes all means of transport used for business travel, such as air travel, rental
cars, private cars, trains, buses and taxis.
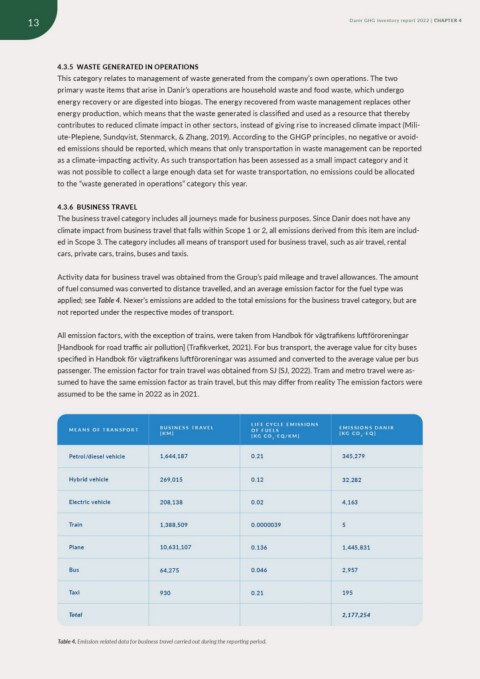
Activity data for business travel was obtained from the Group’s paid mileage and travel allowances. The amount
of fuel consumed was converted to distance travelled, and an average emission factor for the fuel type was
applied; see Table 4. Nexer’s emissions are added to the total emissions for the business travel category, but are
not reported under the respective modes of transport.
All emission factors, with the exception of trains, were taken from Handbok för vägtrafikens luftföroreningar
[Handbook for road traffic air pollution] (Trafikverket, 2021). For bus transport, the average value for city buses
specified in Handbok för vägtrafikens luftföroreningar was assumed and converted to the average value per bus
passenger. The emission factor for train travel was obtained from SJ (SJ, 2022). Tram and metro travel were as-
sumed to have the same emission factor as train travel, but this may differ from reality The emission factors were
assumed to be the same in 2022 as in 2021.
MEANS OF TRANSPORT BUSINESS TRAVEL LIFE CYCLE EMISSIONS EMISSIONS DANIR
[KM] OF FUELS [KG CO2-EQ]
Petrol/diesel vehicle 1,644,187 [KG CO2-EQ/KM]
Hybrid vehicle 269,015 0.21 345,279
Electric vehicle 208,138 32,282
Train 1,388,509 0.12 4,163
Plane 10,631,107 5
Bus 64,275 0.02 1,445,831
Taxi 930 2,957
Total 0.0000039 195
2,177,254
0.136
0.046
0.21
Table 4. Emission-related data for business travel carried out during the reporting period.