
Page 16 - Danir_Klimatbokslut_digital_2022_ENG_240122
P. 16
CHAPTER 5 | Danir GHG inventory report 2022 16
5. Summary of results
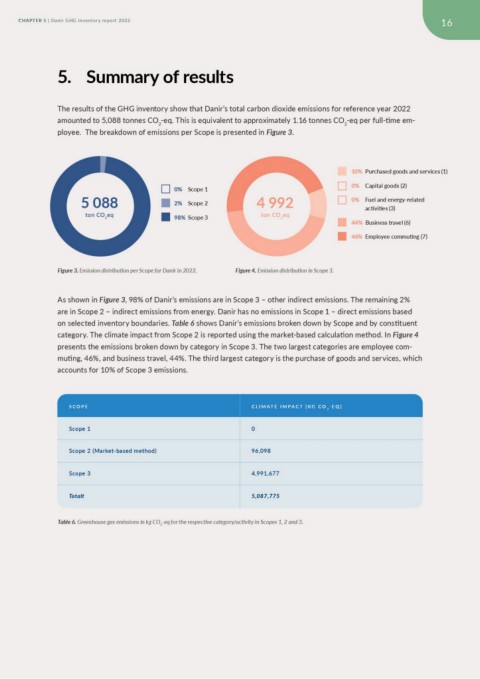
The results of the GHG inventory show that Danir’s total carbon dioxide emissions for reference year 2022
amounted to 5,088 tonnes CO2-eq. This is equivalent to approximately 1.16 tonnes CO2-eq per full-time em-
ployee. The breakdown of emissions per Scope is presented in Figure 3.
5 088 0% Scope 1 4 992 10% Purchased goods and services (1)
2% Scope 2 0% Capital goods (2)
ton CO2eq 98% Scope 3 ton CO2eq 0% Fuel and energy-related
activities (3)
44% Business travel (6)
46% Employee commuting (7)
Figure 3. Emission distribution per Scope for Danir in 2022. Figure 4. Emission distribution in Scope 3.
As shown in Figure 3, 98% of Danir’s emissions are in Scope 3 – other indirect emissions. The remaining 2%
are in Scope 2 – indirect emissions from energy. Danir has no emissions in Scope 1 – direct emissions based
on selected inventory boundaries. Table 6 shows Danir’s emissions broken down by Scope and by constituent
category. The climate impact from Scope 2 is reported using the market-based calculation method. In Figure 4
presents the emissions broken down by category in Scope 3. The two largest categories are employee com-
muting, 46%, and business travel, 44%. The third largest category is the purchase of goods and services, which
accounts for 10% of Scope 3 emissions.
SCOPE CLIMATE IMPACT [KG CO2-EQ]
Scope 1 0
Scope 2 (Market-based method) 96,098
Scope 3 4,991,677
Totalt 5,087,775
Table 6. Greenhouse gas emissions in kg CO2-eq for the respective category/activity in Scopes 1, 2 and 3.