
Page 22 - Danir_Klimatbokslut_digital_2022_ENG_240122
P. 22
CHAPTER 6 | Danir GHG inventory report 2022 22
6.4 Energy
The emissions included in the energy category, Scope 2, come from heating, cooling and electricity for the
offices and correspond to 2% of Danir’s emissions. Danir has already succeeded in minimising emissions from
its energy use by purchasing a very high proportion of renewable energy with low greenhouse gas emissions.
The offices are also located in modern buildings, and a group-wide energy audit – which maps the amount and
type of energy used – is carried out every four years.
Replacing electricity contracts without emission labelling certificates is a simple way to reduce residual emis-
sions from electricity use. Reviewing the energy classification of the products that need to be replaced is
also an important part of reducing the emissions – as well as the cost – of purchased energy. Origin-labelled
district heating, if it is available for purchase, could also reduce emissions. Since the Group has a lot of lever-
age in this category, emission reduction measures should be focused here.
6.5 Comparison with GHG inventories of previous years
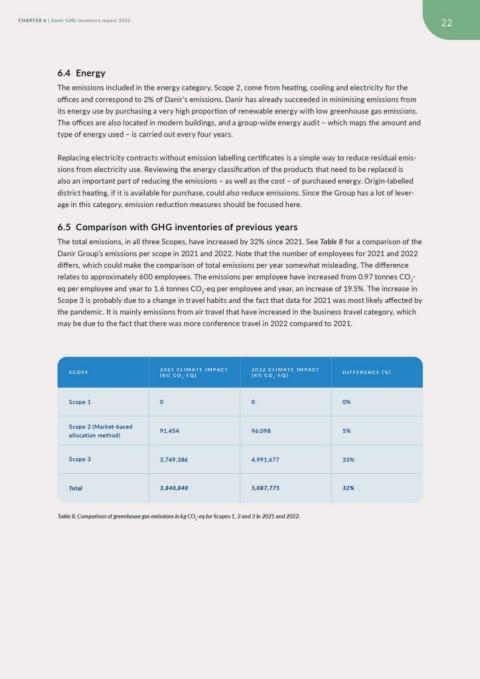
The total emissions, in all three Scopes, have increased by 32% since 2021. See Table 8 for a comparison of the
Danir Group’s emissions per scope in 2021 and 2022. Note that the number of employees for 2021 and 2022
differs, which could make the comparison of total emissions per year somewhat misleading. The difference
relates to approximately 600 employees. The emissions per employee have increased from 0.97 tonnes CO2-
eq per employee and year to 1.6 tonnes CO2-eq per employee and year, an increase of 19.5%. The increase in
Scope 3 is probably due to a change in travel habits and the fact that data for 2021 was most likely affected by
the pandemic. It is mainly emissions from air travel that have increased in the business travel category, which
may be due to the fact that there was more conference travel in 2022 compared to 2021.
SCOPE 2021 CLIMATE IMPACT 2022 CLIMATE IMPACT DIFFERENCE (%)
[KG CO2-EQ] [KG CO2-EQ] 0%
Scope 1
Scope 2 (Market-based 0 0
allocation method)
Scope 3 91,454 96,098 5%
3,749,386 4,991,677 33%
Total 3,840,840 5,087,775 32%
Table 8. Comparison of greenhouse gas emissions in kg CO2-eq for Scopes 1, 2 and 3 in 2021 and 2022.