
Page 19 - Danir_Klimatbokslut_digital_2022_ENG_240122
P. 19
19 Danir GHG inventory report 2022 | CHAPTER 6
The emissions from this category were systematically scaled up to cover each employee’s emissions, which
introduces uncertainty into the results. As commuting is based on a sample of employees, the results may
differ from reality, according to the 6.5% margin of error. All emissions from this category are calculated with
a derived emission factor per employee and year, so that it would be possible to compare data between
different companies. Emissions are based on 4,375 employees.
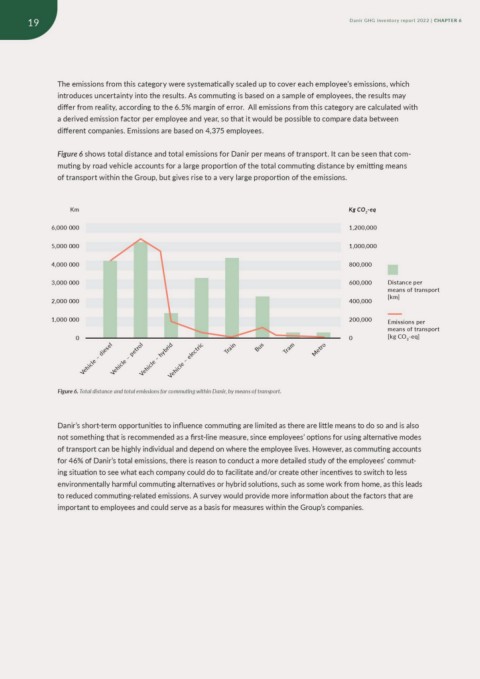
Figure 6 shows total distance and total emissions for Danir per means of transport. It can be seen that com-
muting by road vehicle accounts for a large proportion of the total commuting distance by emitting means
of transport within the Group, but gives rise to a very large proportion of the emissions.
Km Kg CO2-eq
6,000 000 1,200,000
5,000 000
4,000 000 1,000,000
3,000 000
2,000 000 800,000
1,000 000
600,000 Distance per
0 400,000 means of transport
[km]
200,000 Emissions per
0 means of transport
[kg CO2-eq]
VeVVVeheeihhhiciilccclelleee––––elhpdeiyecebttrrsriioecldl
Train
Bus
Tram
Metro
Figure 6. Total distance and total emissions for commuting within Danir, by means of transport.
Danir’s short-term opportunities to influence commuting are limited as there are little means to do so and is also
not something that is recommended as a first-line measure, since employees’ options for using alternative modes
of transport can be highly individual and depend on where the employee lives. However, as commuting accounts
for 46% of Danir’s total emissions, there is reason to conduct a more detailed study of the employees’ commut-
ing situation to see what each company could do to facilitate and/or create other incentives to switch to less
environmentally harmful commuting alternatives or hybrid solutions, such as some work from home, as this leads
to reduced commuting-related emissions. A survey would provide more information about the factors that are
important to employees and could serve as a basis for measures within the Group’s companies.