
Page 21 - Danir_Klimatbokslut_digital_2022_ENG_240122
P. 21
21 Danir GHG inventory report 2022 | CHAPTER 6
6.3 Business travel
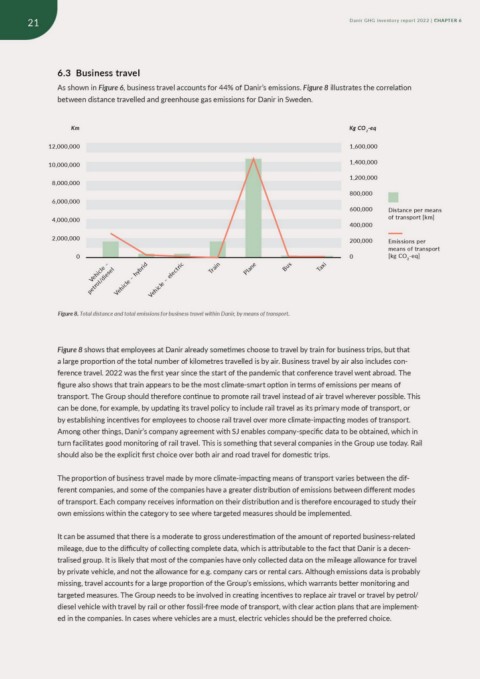
As shown in Figure 6, business travel accounts for 44% of Danir’s emissions. Figure 8 illustrates the correlation
between distance travelled and greenhouse gas emissions for Danir in Sweden.
Km Kg CO2-eq
12,000,000
10,000,000 1,600,000
8,000,000 1,400,000
6,000,000
4,000,000 1,200,000
2,000,000
800,000
0
600,000 Distance per means
400,000 of transport [km]
200,000 Emissions per
0 means of transport
[kg CO2-eq]
Vpeehtirclole/Vd–eiehhisycelblerid–
Vehicle – electric
Train
Plane
Bus
Taxi
Figure 8. Total distance and total emissions for business travel within Danir, by means of transport.
Figure 8 shows that employees at Danir already sometimes choose to travel by train for business trips, but that
a large proportion of the total number of kilometres travelled is by air. Business travel by air also includes con-
ference travel. 2022 was the first year since the start of the pandemic that conference travel went abroad. The
figure also shows that train appears to be the most climate-smart option in terms of emissions per means of
transport. The Group should therefore continue to promote rail travel instead of air travel wherever possible. This
can be done, for example, by updating its travel policy to include rail travel as its primary mode of transport, or
by establishing incentives for employees to choose rail travel over more climate-impacting modes of transport.
Among other things, Danir’s company agreement with SJ enables company-specific data to be obtained, which in
turn facilitates good monitoring of rail travel. This is something that several companies in the Group use today. Rail
should also be the explicit first choice over both air and road travel for domestic trips.
The proportion of business travel made by more climate-impacting means of transport varies between the dif-
ferent companies, and some of the companies have a greater distribution of emissions between different modes
of transport. Each company receives information on their distribution and is therefore encouraged to study their
own emissions within the category to see where targeted measures should be implemented.
It can be assumed that there is a moderate to gross underestimation of the amount of reported business-related
mileage, due to the difficulty of collecting complete data, which is attributable to the fact that Danir is a decen-
tralised group. It is likely that most of the companies have only collected data on the mileage allowance for travel
by private vehicle, and not the allowance for e.g. company cars or rental cars. Although emissions data is probably
missing, travel accounts for a large proportion of the Group’s emissions, which warrants better monitoring and
targeted measures. The Group needs to be involved in creating incentives to replace air travel or travel by petrol/
diesel vehicle with travel by rail or other fossil-free mode of transport, with clear action plans that are implement-
ed in the companies. In cases where vehicles are a must, electric vehicles should be the preferred choice.