
Page 15 - Danir_Klimatbokslut_digital_2023_ENG
P. 15
CHAPTER 4 | Danir GHG inventory report 2023 15
4 GHG inventory results
The GHG inventory is primarily based on company-specific data which is collected from each company.
In cases where company-specific data was not available, representative templates were used, which are
described in more detail under each activity category. It is important to keep in mind that some of the
categories might be undervalued or overvalued, as the data has been collected through a responsible person
at each subsidiary. The method used by the responsible person to collect data for travel and purchases could
not be followed up or compared between companies. As a result, there is a risk that some emission-generating
items were not counted and therefore not included in the report. Data for employee commuting was
collected from a sampling of employees and then scaled up to the total number of employees included in the
GHG inventory. The results from this GHG inventory are presented in Scopes 1, 2, and 3, as defined by the
GHG Protocol and results are based on 7,665 employees. These scopes are also divided into their respective
subcategories in the results section below.
4.1 Summary of GHG inventory
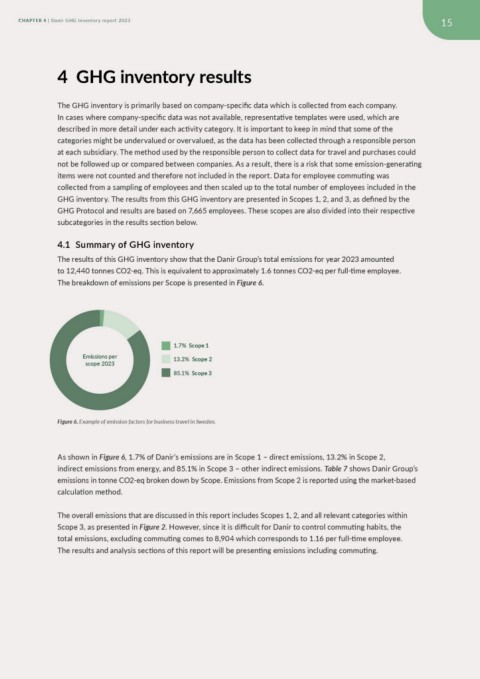
The results of this GHG inventory show that the Danir Group’s total emissions for year 2023 amounted
to 12,440 tonnes CO2-eq. This is equivalent to approximately 1.6 tonnes CO2-eq per full-time employee.
The breakdown of emissions per Scope is presented in Figure 6.
Emissions per 1.7% Scope 1
scope 2023 13.2% Scope 2
85.1% Scope 3
Figure 6. Example of emission factors for business travel in Sweden.
As shown in Figure 6, 1.7% of Danir’s emissions are in Scope 1 – direct emissions, 13.2% in Scope 2,
indirect emissions from energy, and 85.1% in Scope 3 – other indirect emissions. Table 7 shows Danir Group’s
emissions in tonne CO2-eq broken down by Scope. Emissions from Scope 2 is reported using the market-based
calculation method.
The overall emissions that are discussed in this report includes Scopes 1, 2, and all relevant categories within
Scope 3, as presented in Figure 2. However, since it is difficult for Danir to control commuting habits, the
total emissions, excluding commuting comes to 8,904 which corresponds to 1.16 per full-time employee.
The results and analysis sections of this report will be presenting emissions including commuting.