
Page 17 - Danir_Klimatbokslut_digital_2023_ENG
P. 17
CHAPTER 4 | Danir GHG inventory report 2023 17
4.3.1 COMPARISON BETWEEN MARKET-BASED AND LOCATION-BASED CALCULATION METHODS
Table 9 presents a comparison of how emissions from purchased electricity, heating, and cooling differ
depending on allocation method.
In Danir Group’s case, the carbon footprint obtained by applying the location-based allocation method is
marginally higher than when the market-based method is applied. In terms of actual emissions, the difference
between the two calculation methods is approximately 37 tonne CO2-eq. The market-based allocation
method – on which the primary results of the GHG inventory are based – considers trade in origin-labelled
electricity and district heating. This creates an incentive to choose a renewable energy contract (where
available) and shows that the climate impact of purchased electricity and heating is something that can be
influenced by active choices.
SCOPE 2 EMISSIONS – FROM PRODUCTION OF PURCHASED ENERGY [TONNE CO2-EQ]
Location-based allocation method Market-based allocation method
1,683.3 1,646.3
Table 9. Emissions from the production of purchased electricity, reported by applying the location-based and the market-based allocation method.
4.4 Scope 3
Scope 3 is comprised of indirect emissions up and downstream of Danir Group’s value chain. The relevant
Scope 3 categories which are included in the system boundaries of this GHG inventory is purchased goods and
services, capital goods, business travel, fuel and energy related activities, waste, and employee commuting.
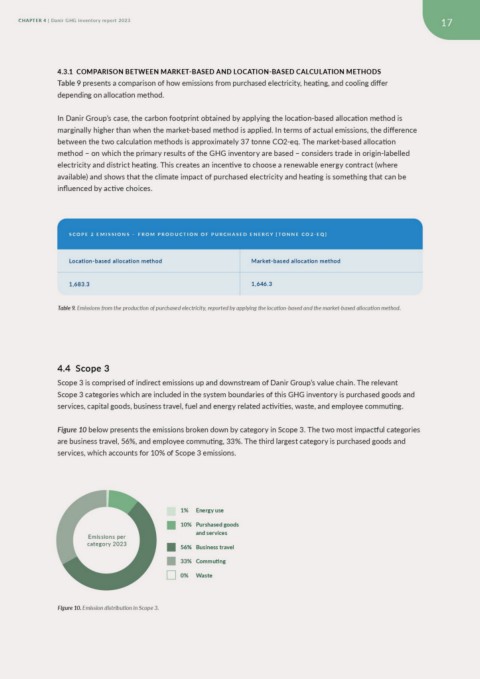
Figure 10 below presents the emissions broken down by category in Scope 3. The two most impactful categories
are business travel, 56%, and employee commuting, 33%. The third largest category is purchased goods and
services, which accounts for 10% of Scope 3 emissions.
Emissions per 1% Energy use
category 2023 10% Purshased goods
and services
56% Business travel
33% Commuting
0% Waste
Figure 10. Emission distribution in Scope 3.