
Page 19 - Danir_Klimatbokslut_digital_2023_ENG
P. 19
CHAPTER 4 | Danir GHG inventory report 2023 19
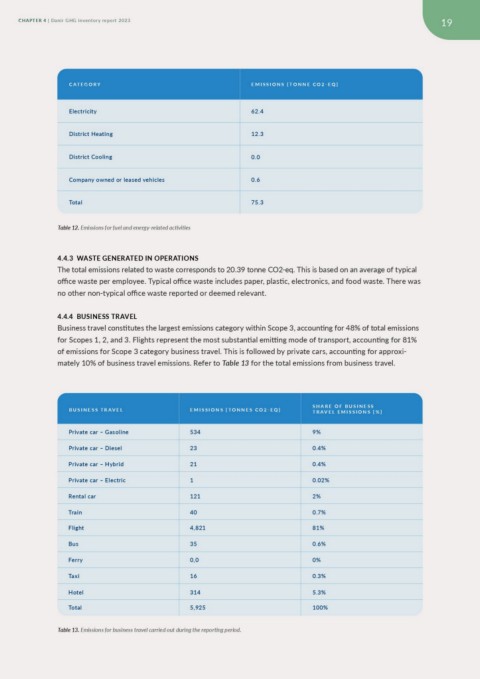
C AT E G O R Y EMISSIONS [TONNE CO2-EQ]
Electricity
District Heating 62.4
District Cooling 12.3
Company owned or leased vehicles 0.0
Total 0.6
Table 12. Emissions for fuel and energy-related activities 75.3
4.4.3 WASTE GENERATED IN OPERATIONS
The total emissions related to waste corresponds to 20.39 tonne CO2-eq. This is based on an average of typical
office waste per employee. Typical office waste includes paper, plastic, electronics, and food waste. There was
no other non-typical office waste reported or deemed relevant.
4.4.4 BUSINESS TRAVEL
Business travel constitutes the largest emissions category within Scope 3, accounting for 48% of total emissions
for Scopes 1, 2, and 3. Flights represent the most substantial emitting mode of transport, accounting for 81%
of emissions for Scope 3 category business travel. This is followed by private cars, accounting for approxi-
mately 10% of business travel emissions. Refer to Table 13 for the total emissions from business travel.
BUSINESS TRAVEL EMISSIONS [TONNES CO2-EQ] SHARE OF BUSINESS
TRAVEL EMISSIONS [%]
Private car – Gasoline 534
Private car – Diesel 23 9%
Private car – Hybrid 21 0.4%
Private car – Electric 1 0.4%
Rental car 121 0.02%
Train 40 2%
Flight 4,821 0.7%
Bus 35 81%
Ferry 0,0 0.6%
Taxi 16 0%
Hotel 314 0.3%
Total 5,925 5.3%
100%
Table 13. Emissions for business travel carried out during the reporting period.