
Page 16 - Danir_Klimatbokslut_digital_2023_ENG
P. 16
16 Danir GHG inventory report 2023 | CHAPTER 4
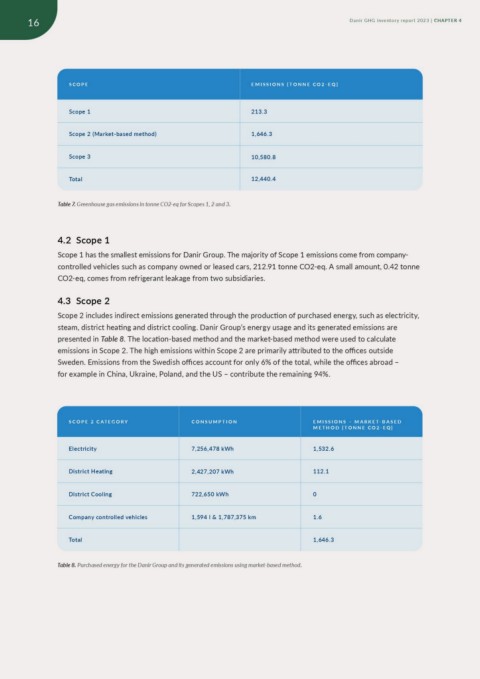
SCOPE EMISSIONS [TONNE CO2-EQ]
Scope 1 213.3
Scope 2 (Market-based method) 1,646.3
Scope 3 10,580.8
Total 12,440.4
Table 7. Greenhouse gas emissions in tonne CO2-eq for Scopes 1, 2 and 3.
4.2 Scope 1
Scope 1 has the smallest emissions for Danir Group. The majority of Scope 1 emissions come from company-
controlled vehicles such as company owned or leased cars, 212.91 tonne CO2-eq. A small amount, 0.42 tonne
CO2-eq, comes from refrigerant leakage from two subsidiaries.
4.3 Scope 2
Scope 2 includes indirect emissions generated through the production of purchased energy, such as electricity,
steam, district heating and district cooling. Danir Group’s energy usage and its generated emissions are
presented in Table 8. The location-based method and the market-based method were used to calculate
emissions in Scope 2. The high emissions within Scope 2 are primarily attributed to the offices outside
Sweden. Emissions from the Swedish offices account for only 6% of the total, while the offices abroad –
for example in China, Ukraine, Poland, and the US – contribute the remaining 94%.
SCOPE 2 CATEGORY CONSUMPTION EMISSIONS – MARKET-BASED
7,256,478 kWh METHOD [TONNE CO2-EQ]
Electricity 2,427,207 kWh 1,532.6
District Heating 722,650 kWh
District Cooling 1,594 l & 1,787,375 km 112.1
Company controlled vehicles
Total 0
1.6
1,646.3
Table 8. Purchased energy for the Danir Group and its generated emissions using market-based method.