
Page 21 - Danir_Klimatbokslut_digital_2023_ENG
P. 21
CHAPTER 5 | Danir GHG inventory report 2023 21
5 Analysis of results
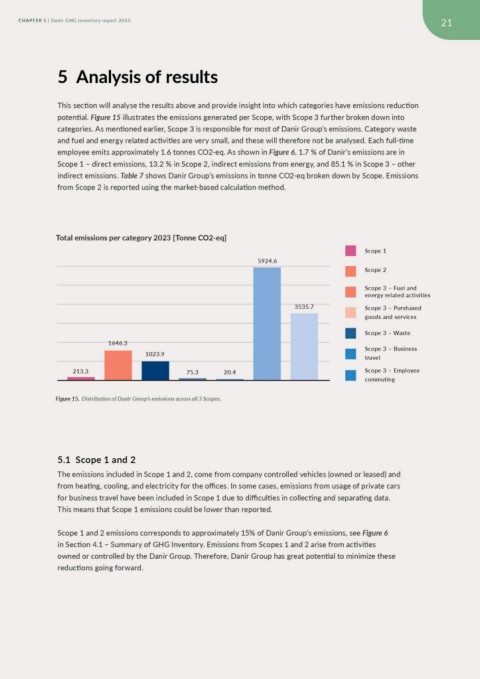
This section will analyse the results above and provide insight into which categories have emissions reduction
potential. Figure 15 illustrates the emissions generated per Scope, with Scope 3 further broken down into
categories. As mentioned earlier, Scope 3 is responsible for most of Danir Group’s emissions. Category waste
and fuel and energy related activities are very small, and these will therefore not be analysed. Each full-time
employee emits approximately 1.6 tonnes CO2-eq. As shown in Figure 6, 1.7 % of Danir’s emissions are in
Scope 1 – direct emissions, 13.2 % in Scope 2, indirect emissions from energy, and 85.1 % in Scope 3 – other
indirect emissions. Table 7 shows Danir Group’s emissions in tonne CO2-eq broken down by Scope. Emissions
from Scope 2 is reported using the market-based calculation method.
Total emissions per category 2023 [Tonne CO2-eq]
5924.6 Scope 1
3535.7 Scope 2
1646.3 Scope 3 – Fuel and
energy related activities
1023.9 Scope 3 – Purshased
goods and services
213.3 75.3 20.4
Scope 3 – Waste
Scope 3 – Business
travel
Scope 3 – Employee
commuting
Figure 15. Distribution of Danir Group’s emissions across all 3 Scopes.
5.1 Scope 1 and 2
The emissions included in Scope 1 and 2, come from company controlled vehicles (owned or leased) and
from heating, cooling, and electricity for the offices. In some cases, emissions from usage of private cars
for business travel have been included in Scope 1 due to difficulties in collecting and separating data.
This means that Scope 1 emissions could be lower than reported.
Scope 1 and 2 emissions corresponds to approximately 15% of Danir Group’s emissions, see Figure 6
in Section 4.1 – Summary of GHG Inventory. Emissions from Scopes 1 and 2 arise from activities
owned or controlled by the Danir Group. Therefore, Danir Group has great potential to minimize these
reductions going forward.