
Page 6 - MELLBY_MAGASIN_2021_EN
P. 6
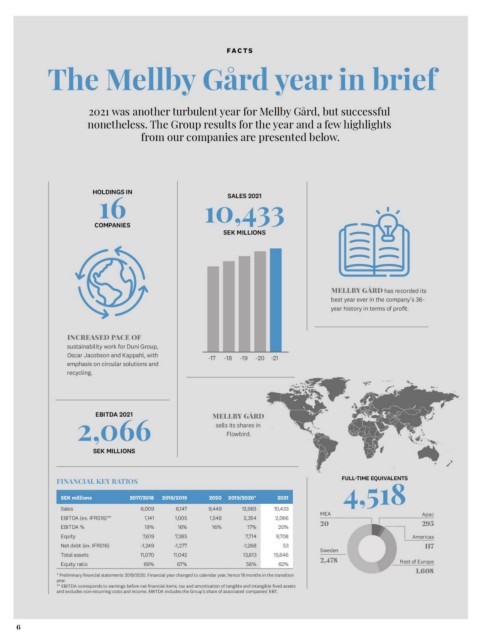
FACTS

   The Mellby Gård year in brief

              2021 was another turbulent year for Mellby Gård, but successful
              nonetheless. The Group results for the year and a few highlights

                             from our companies are presented below.

                 HOLDINGS IN                              SALES 2021

                 16                             10,433
                                                         SEK MILLIONS
                 COMPANIES

                                                                                                                               MELLBY GÅRD has recorded its
                                                                                                                               best year ever in the company’s 36-
                                                                                                                               year history in terms of profit.

   INCREASED PACE OF                            -17 -18 -19 -20 -21
   sustainability work for Duni Group,
   Oscar Jacobson and Kappahl, with
   emphasis on circular solutions and
   recycling.

           EBITDA 2021                          MELLBY GÅRD
                                                 sells its shares in
   2,066
          SEK MILLIONS                                 Flowbird.

   FINANCIAL KEY RATIOS                                                                                                                FULL-TIME EQUIVALENTS

   SEK millions           2017/2018 2018/2019   2020 2019/2020*       2021                                                             4,518

   Sales                      6,009      6,147  9,449  13,983         10,433                                                   MEA                            Apac
   EBITDA (ex. IFRS16)**        1,141   1,005   1,548  2,354          2,066
   EBITDA %                     19%               16%                                                                          20 295
   Equity                      7,619      16%             17%           20%
   Net debt (ex. IFRS16)                7,385            7,714         9,708                                                   Sweden         Americas
   Total assets               -1,249    -1,277         -1,268
   Equity ratio               11,070    11,042         13,813              53                                                  2,478              117
                                         67%             56%          15,646
                               69%                                                                                                     Rest of Europe
                                                                        62%
                                                                                                                                              1,608
   * Preliminary financial statements 2019/2020. Financial year changed to calendar year, hence 18 months in the transition
   year.
   ** EBITDA corresponds to earnings before net financial items, tax and amortisation of tangible and intangible fixed assets
   and excludes non-recurring costs and income. EBITDA includes the Group’s share of associated companies’ EBT.

6